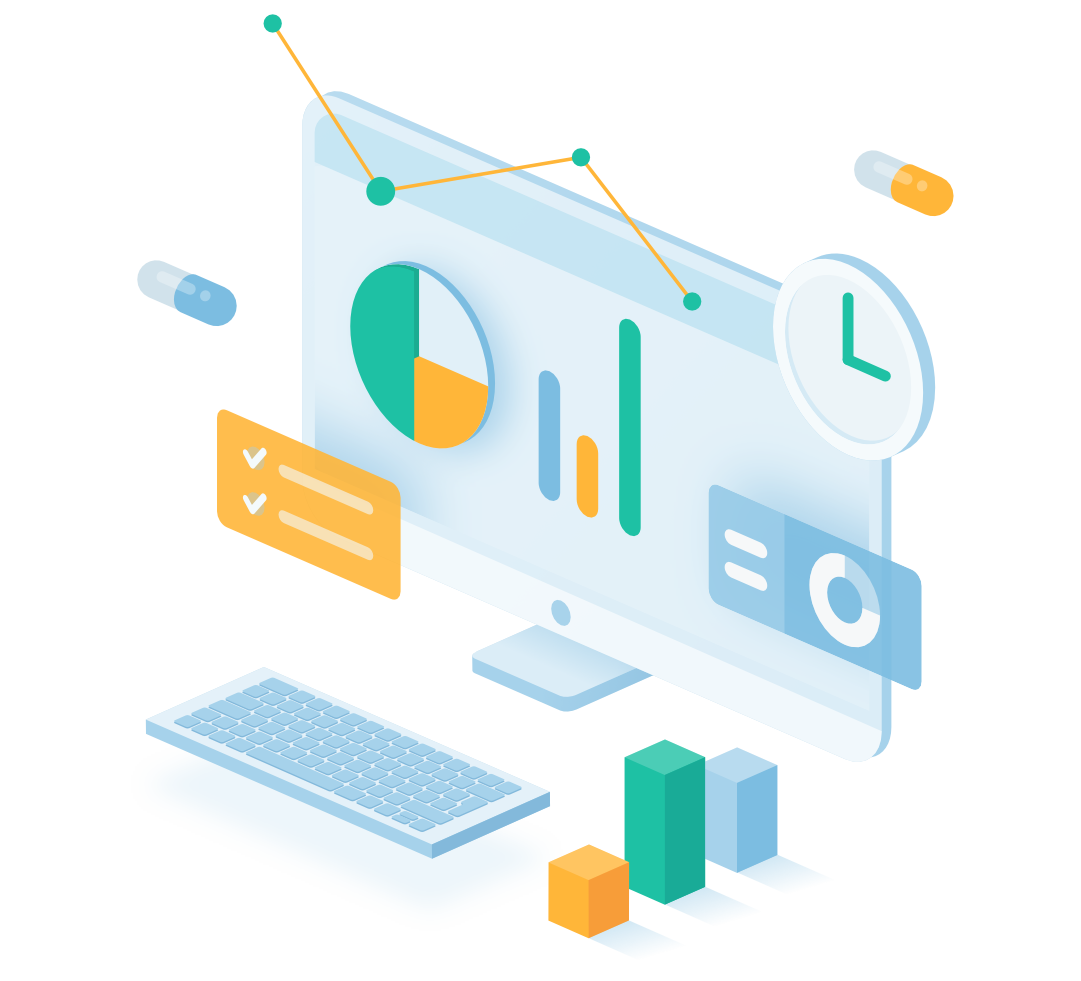
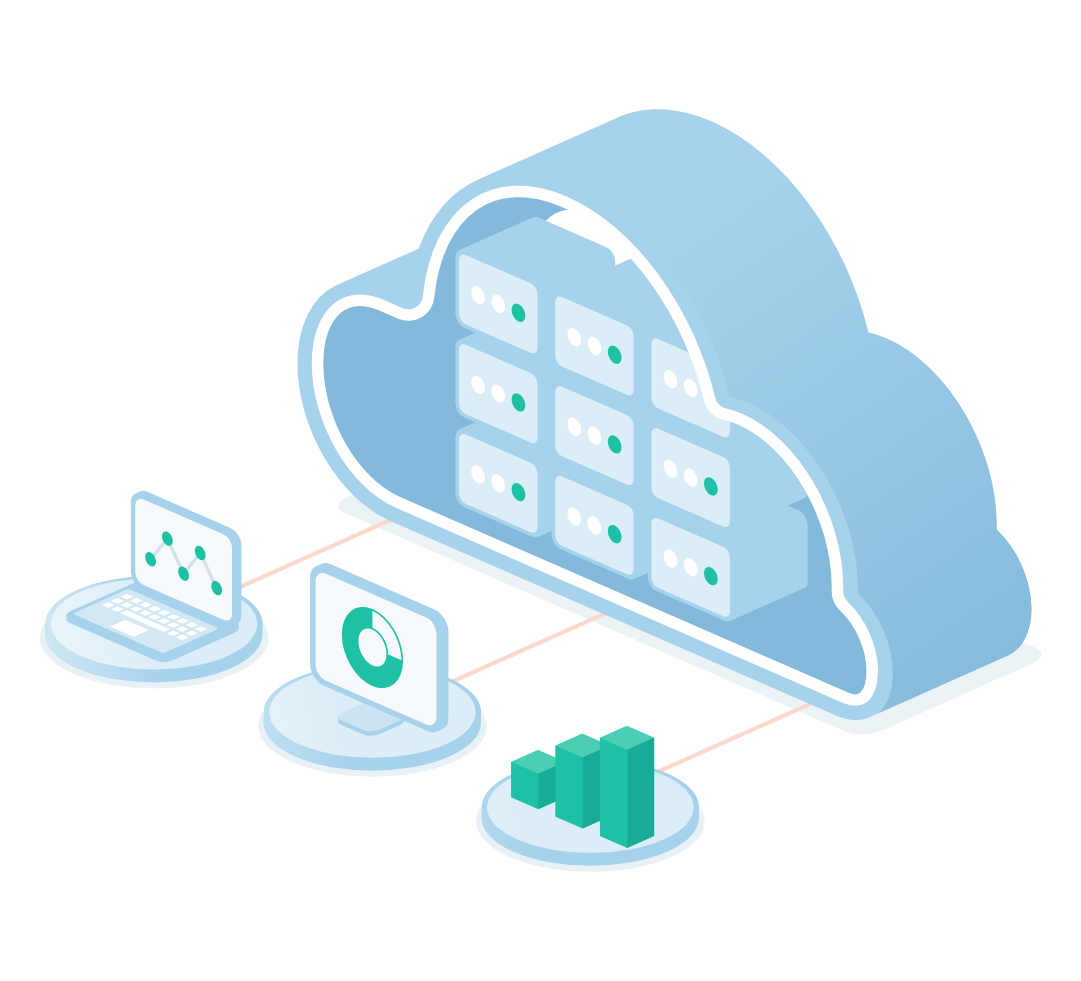
To be accurate, every decision needs to be supported with information gathered through cutting-edge tools. FarmaProm Analytics App is a convenient and efficient solution enabling quick preview of current sales results and visit-related activities on any device (i.e. desktops, laptops, tablets, smartphones).
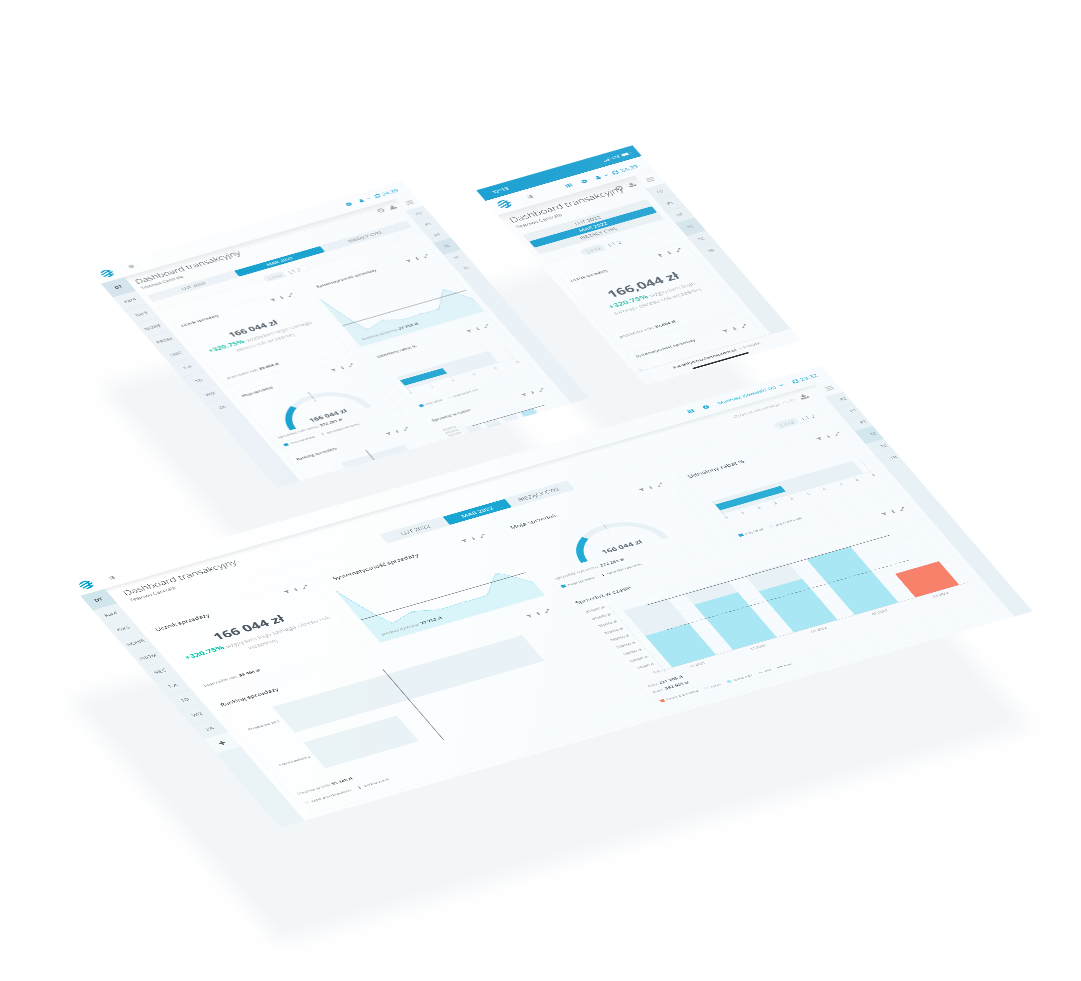
FarmaProm Analytics App with Superuser
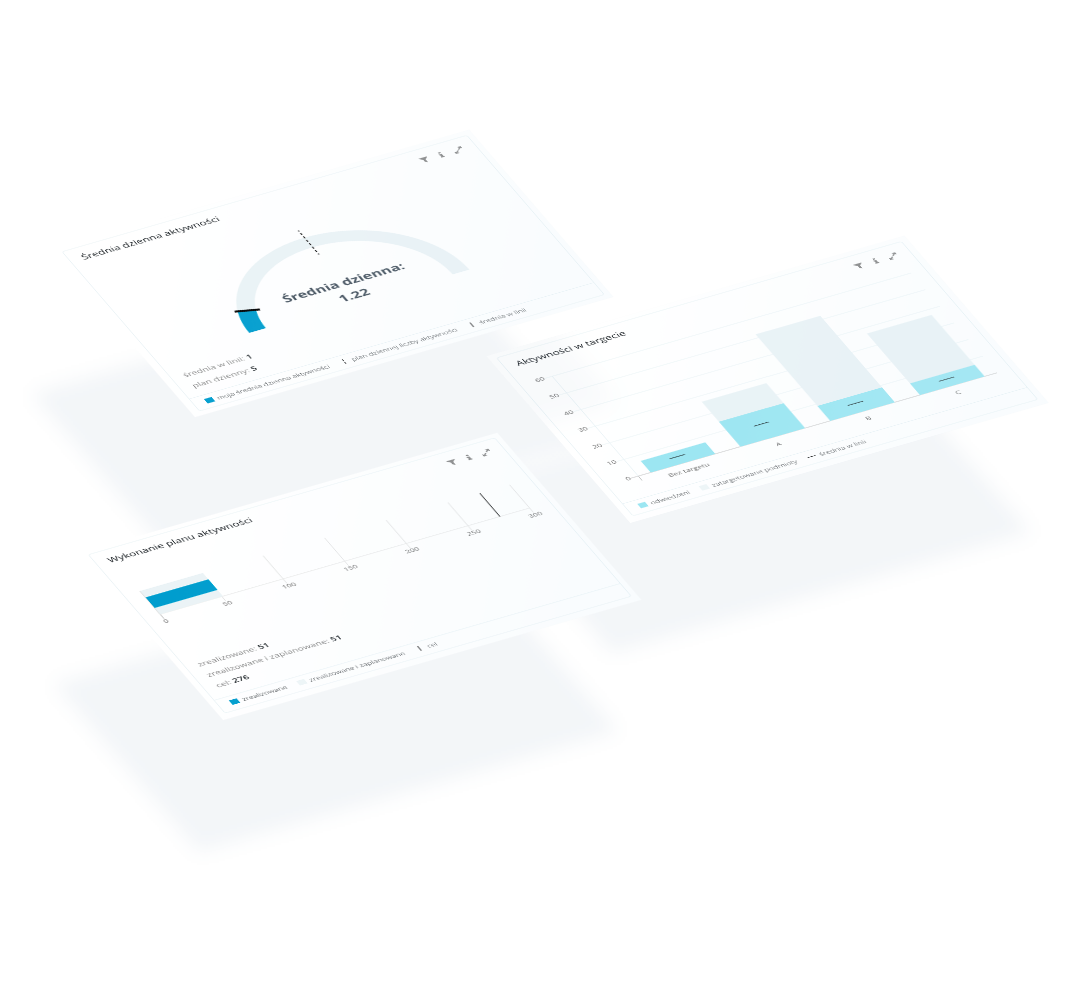
We know how to measure sales efficiently